Poster outlining the map:
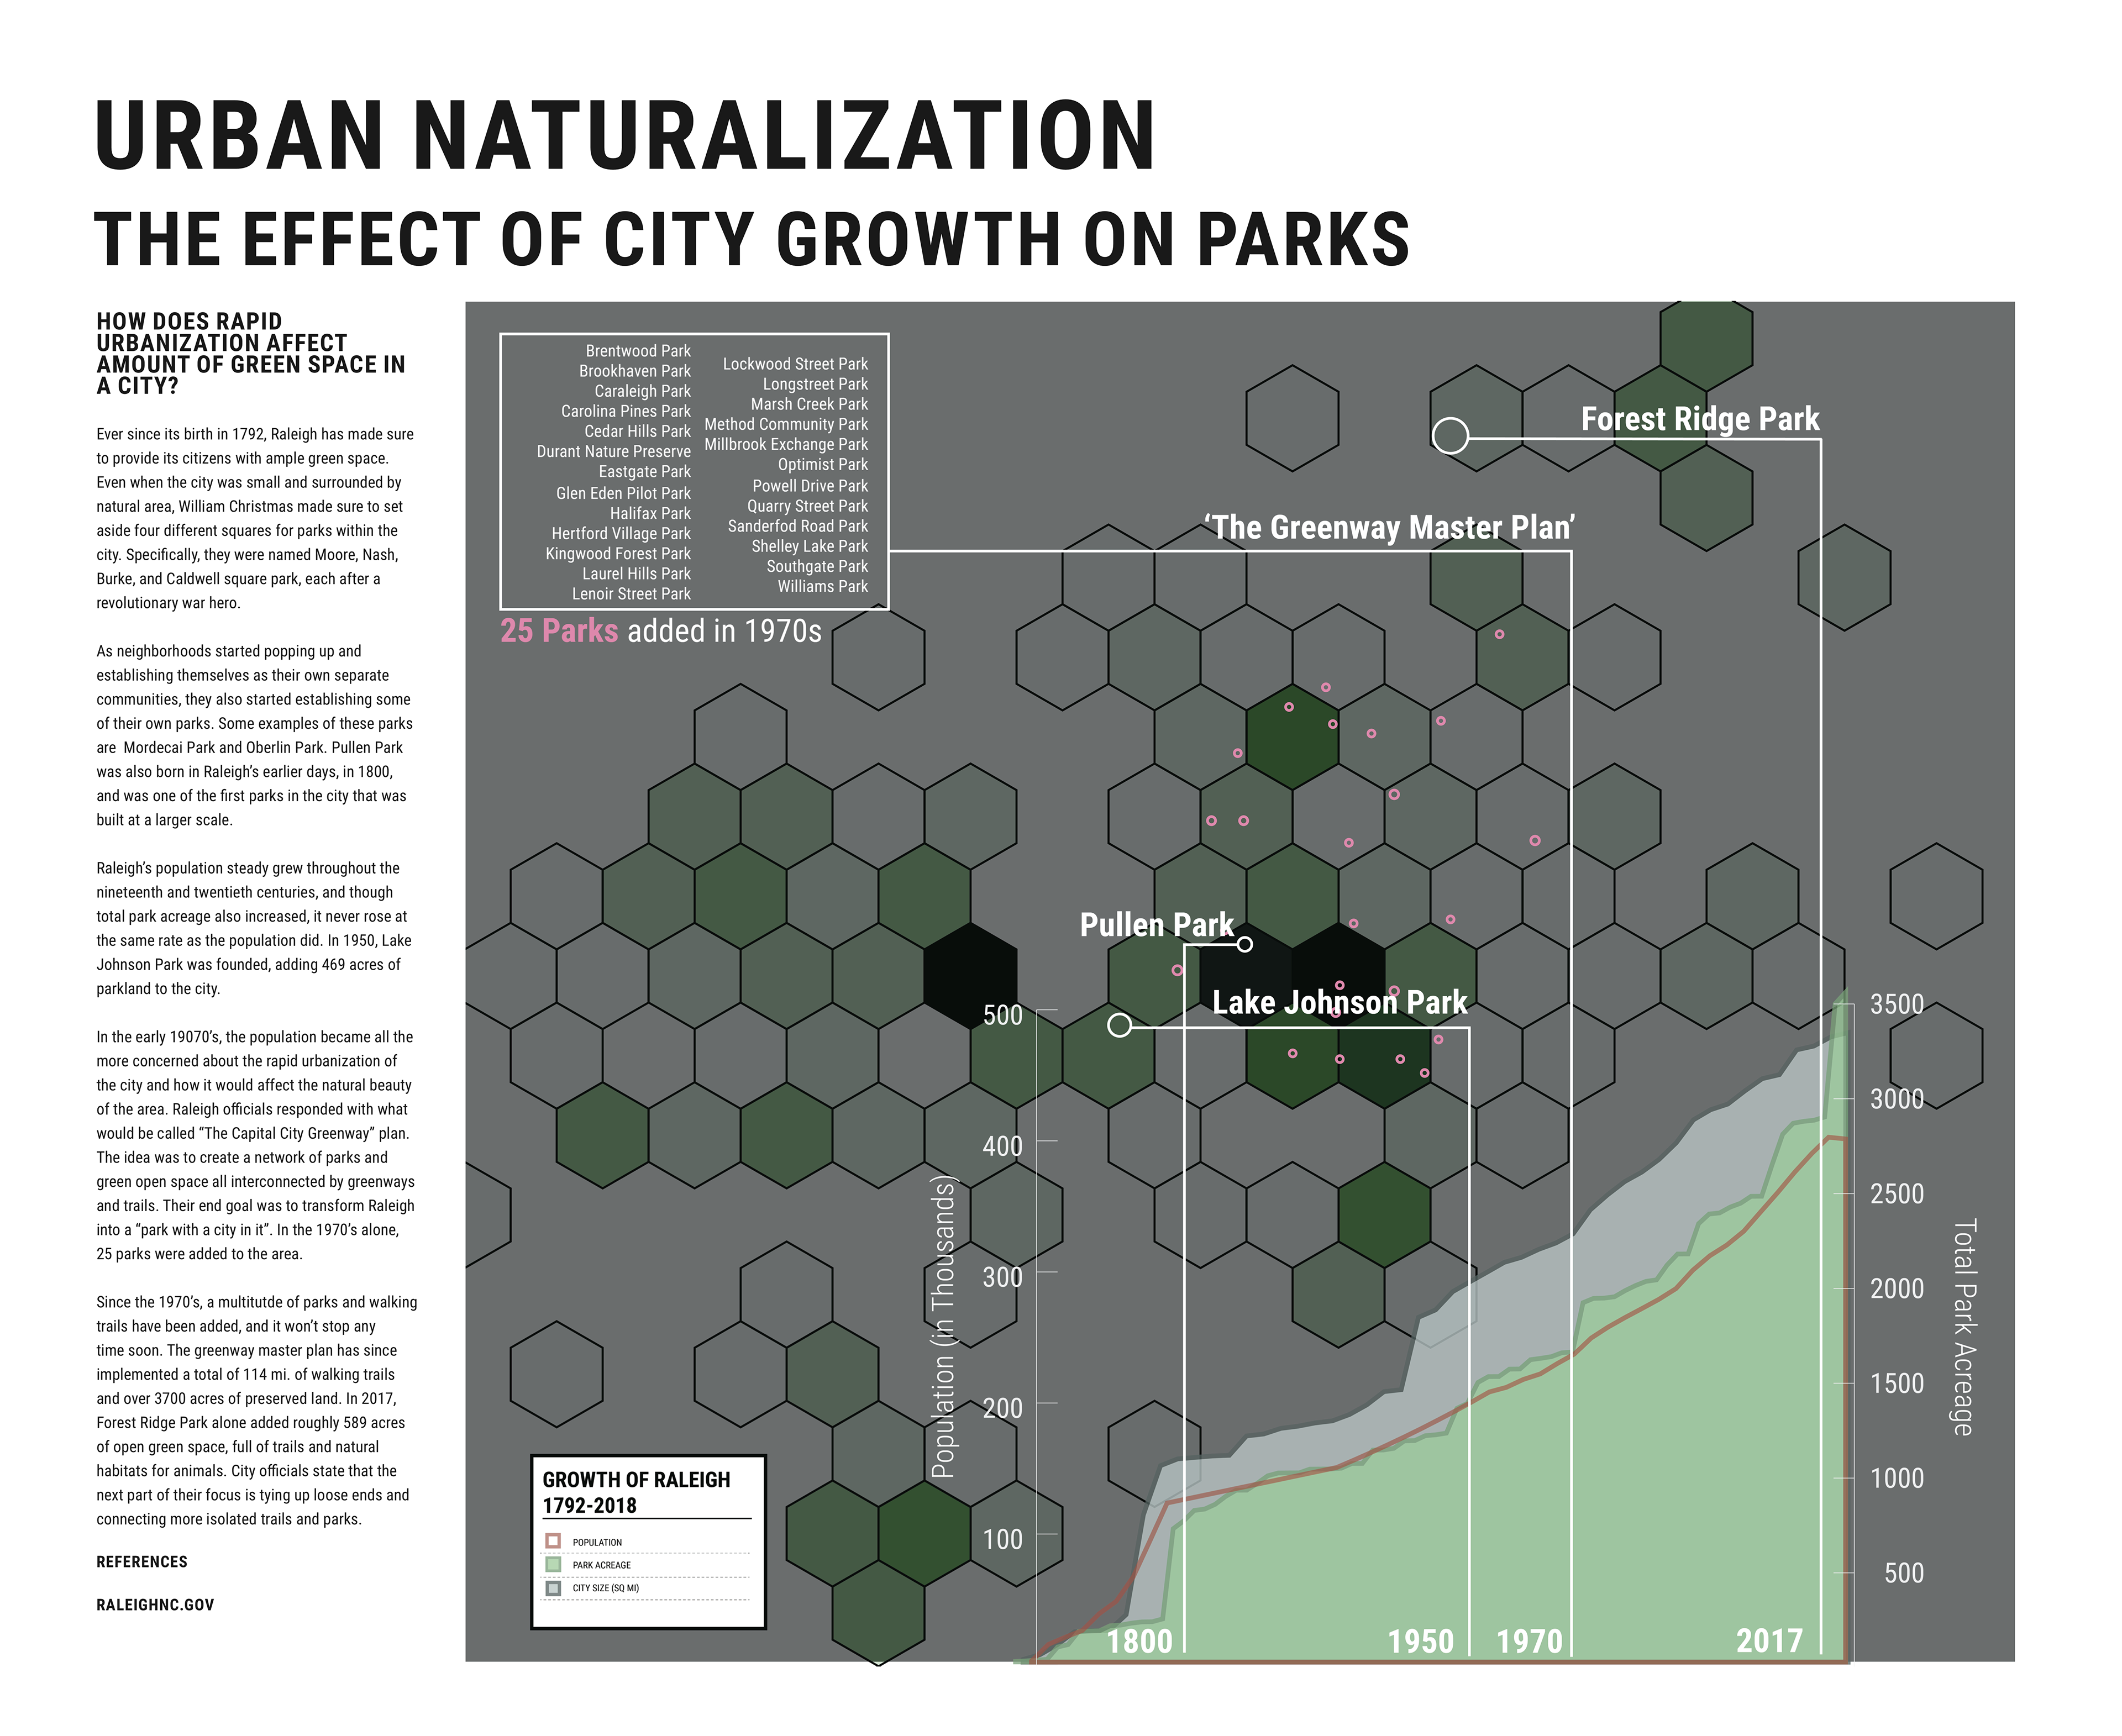

The graph in the lower left explores relative population, sq. mileage, and park acreage of Raleigh over time, in order to see whether rapid urbanization has had an effect on the amount of public greenspace in the city of Raleigh. It is imposed on a chart which shows the dispersion of parks in Raleigh in geospatial hexagons. The call-outs correspond to the times of significant park acreage increase.
Process:
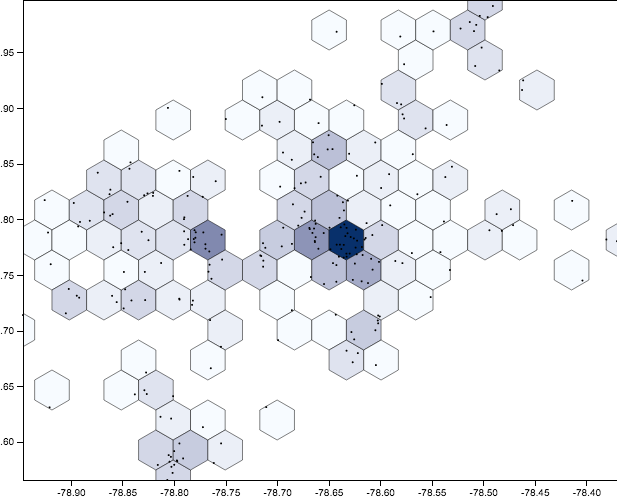
Dispersion of parks in the Raleigh area based on latitude and longitude. The darker the hexagon, the more parks are concentrated in that location.
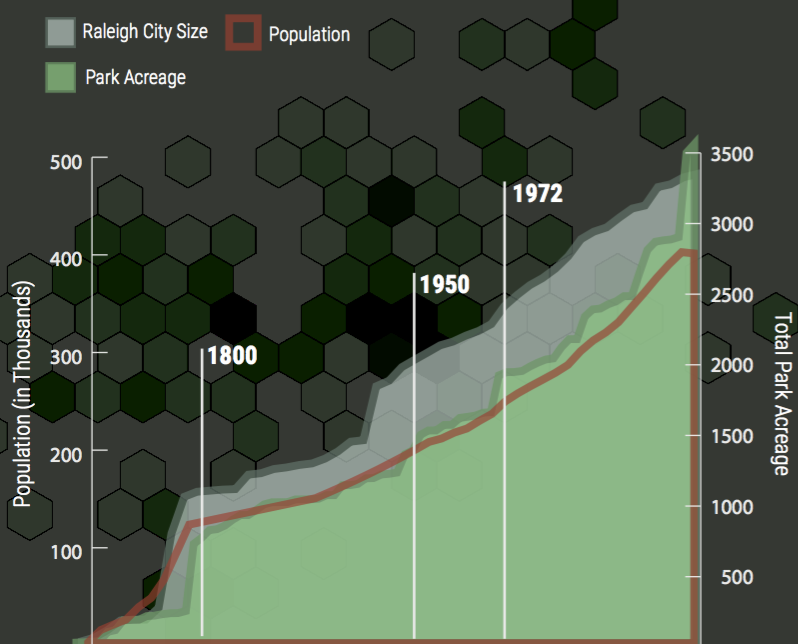
Original render of the information.