
Timeline of the original areas of public greenspace in Raleigh and how they have changed from 1792-2018.

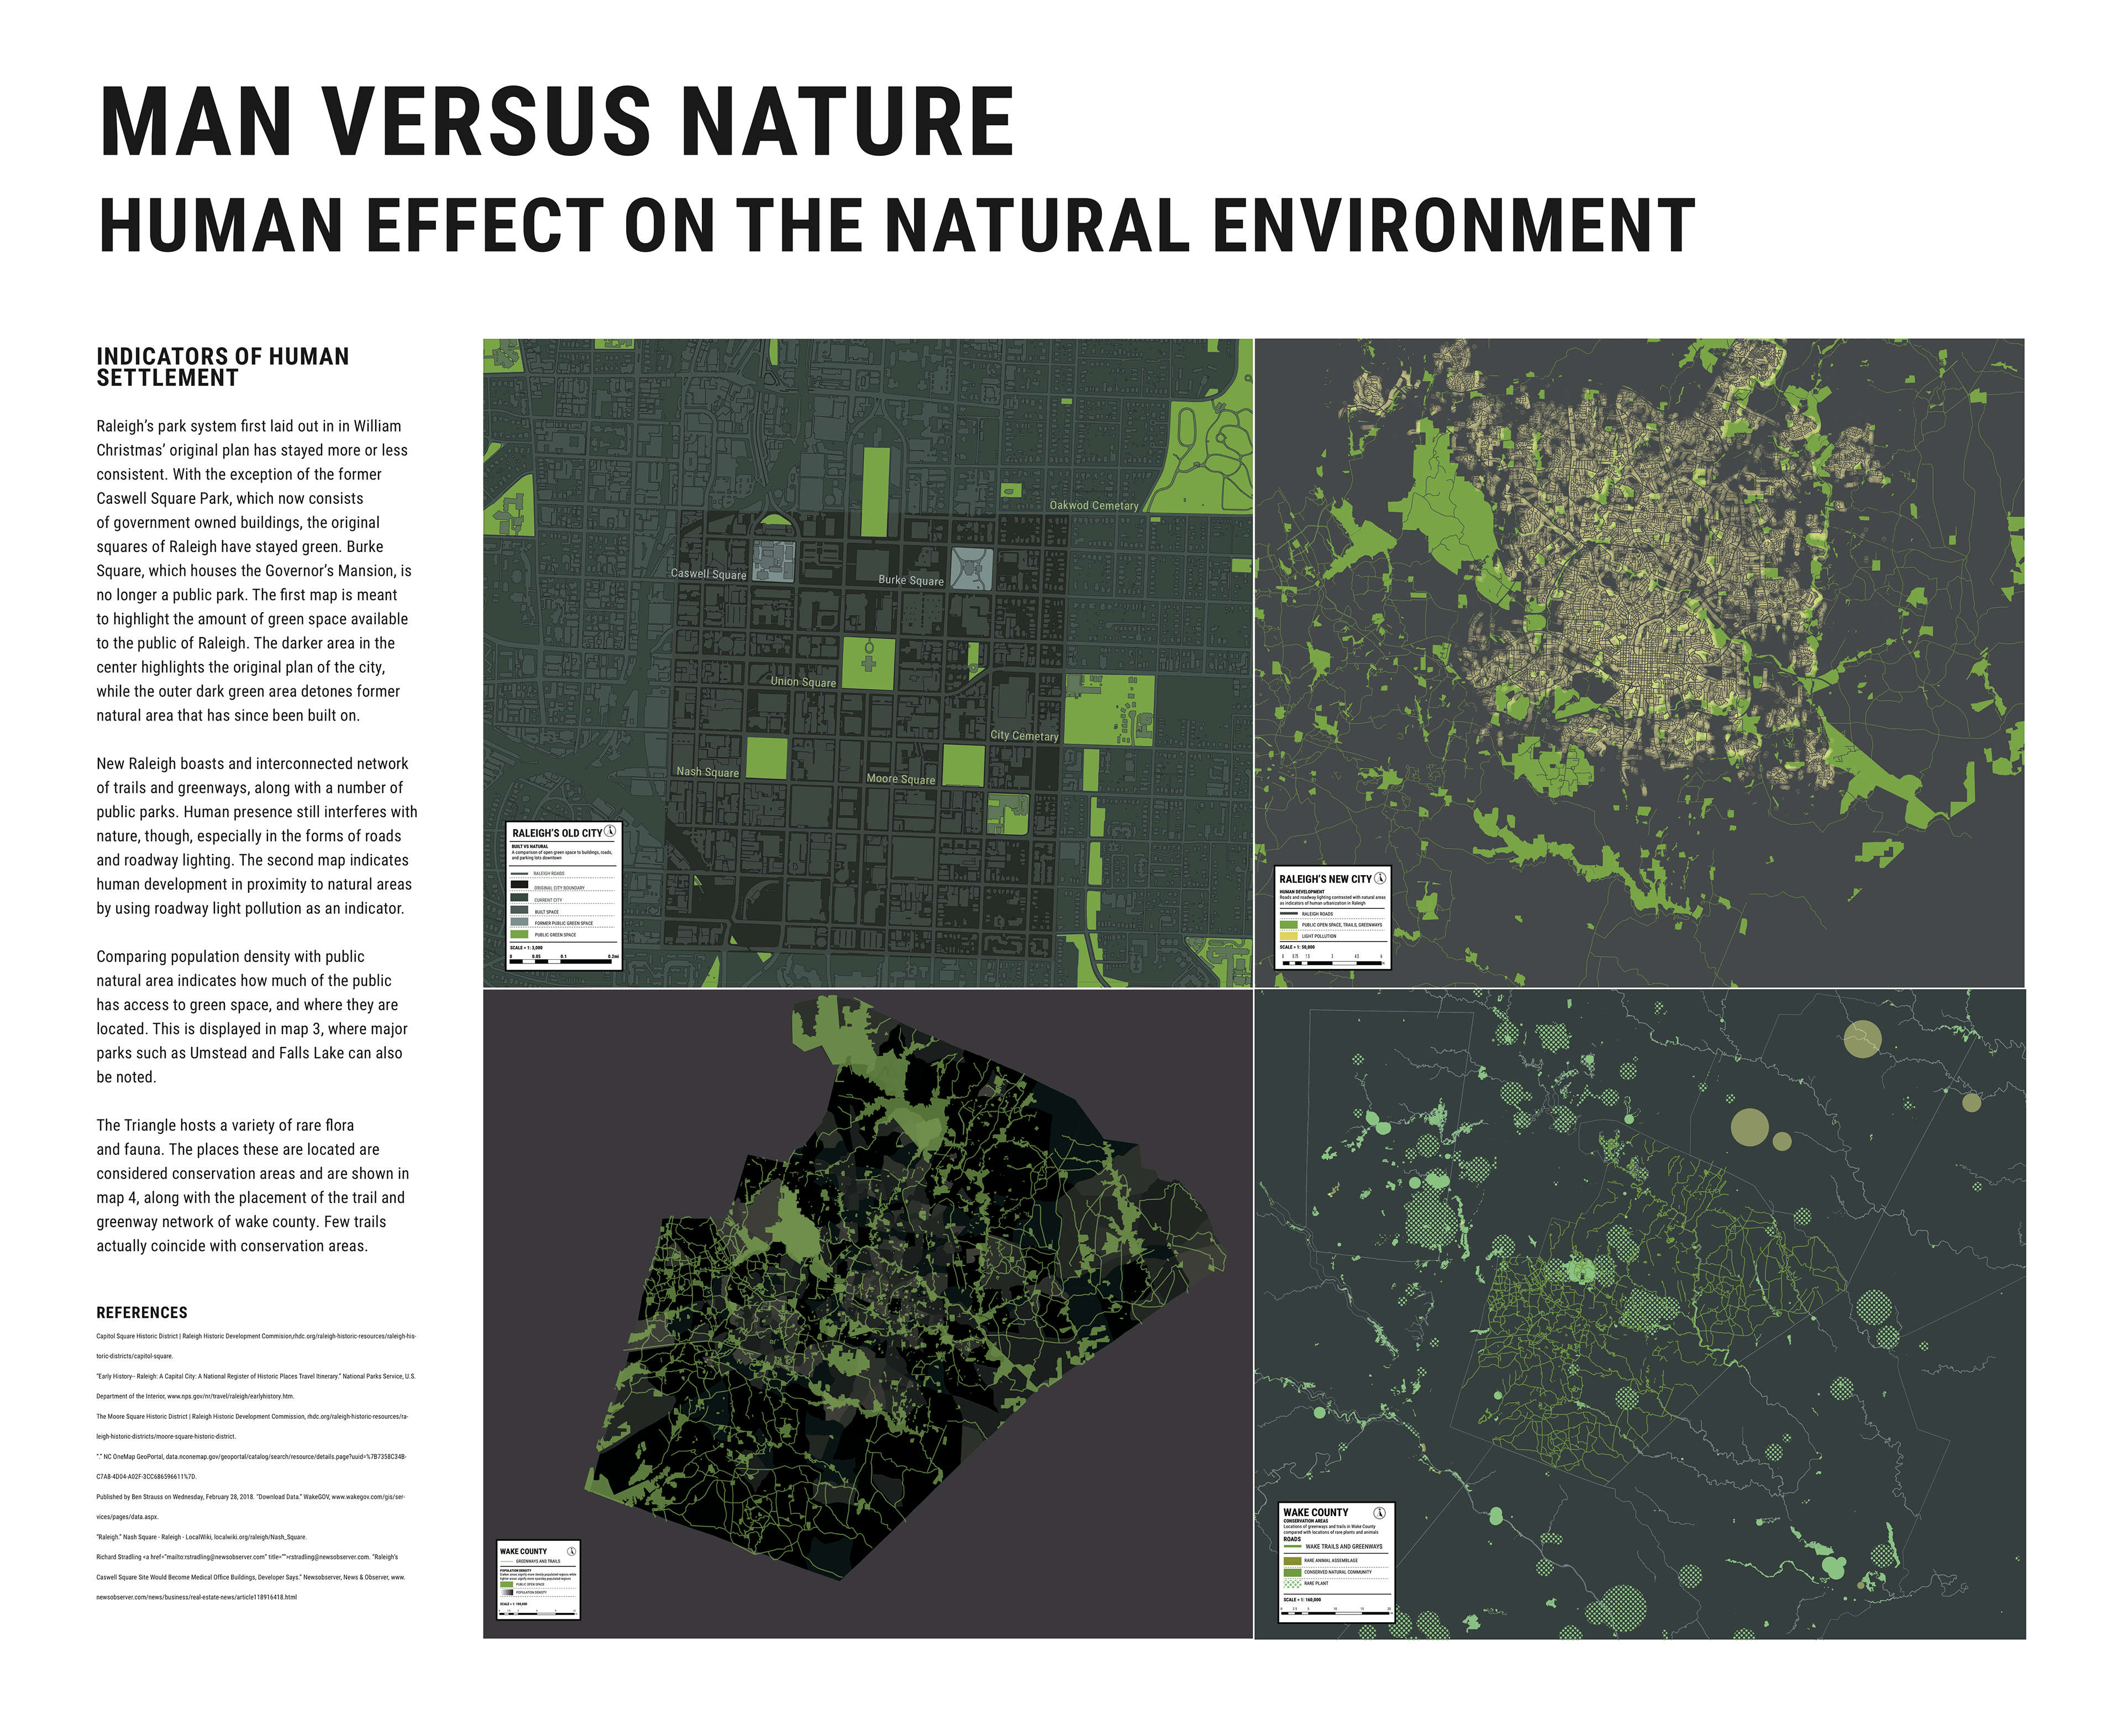
Juxtaposes the built environment in Downtown Raleigh with public open green space; also denotes former green space. How has Raleigh's development changed over time?
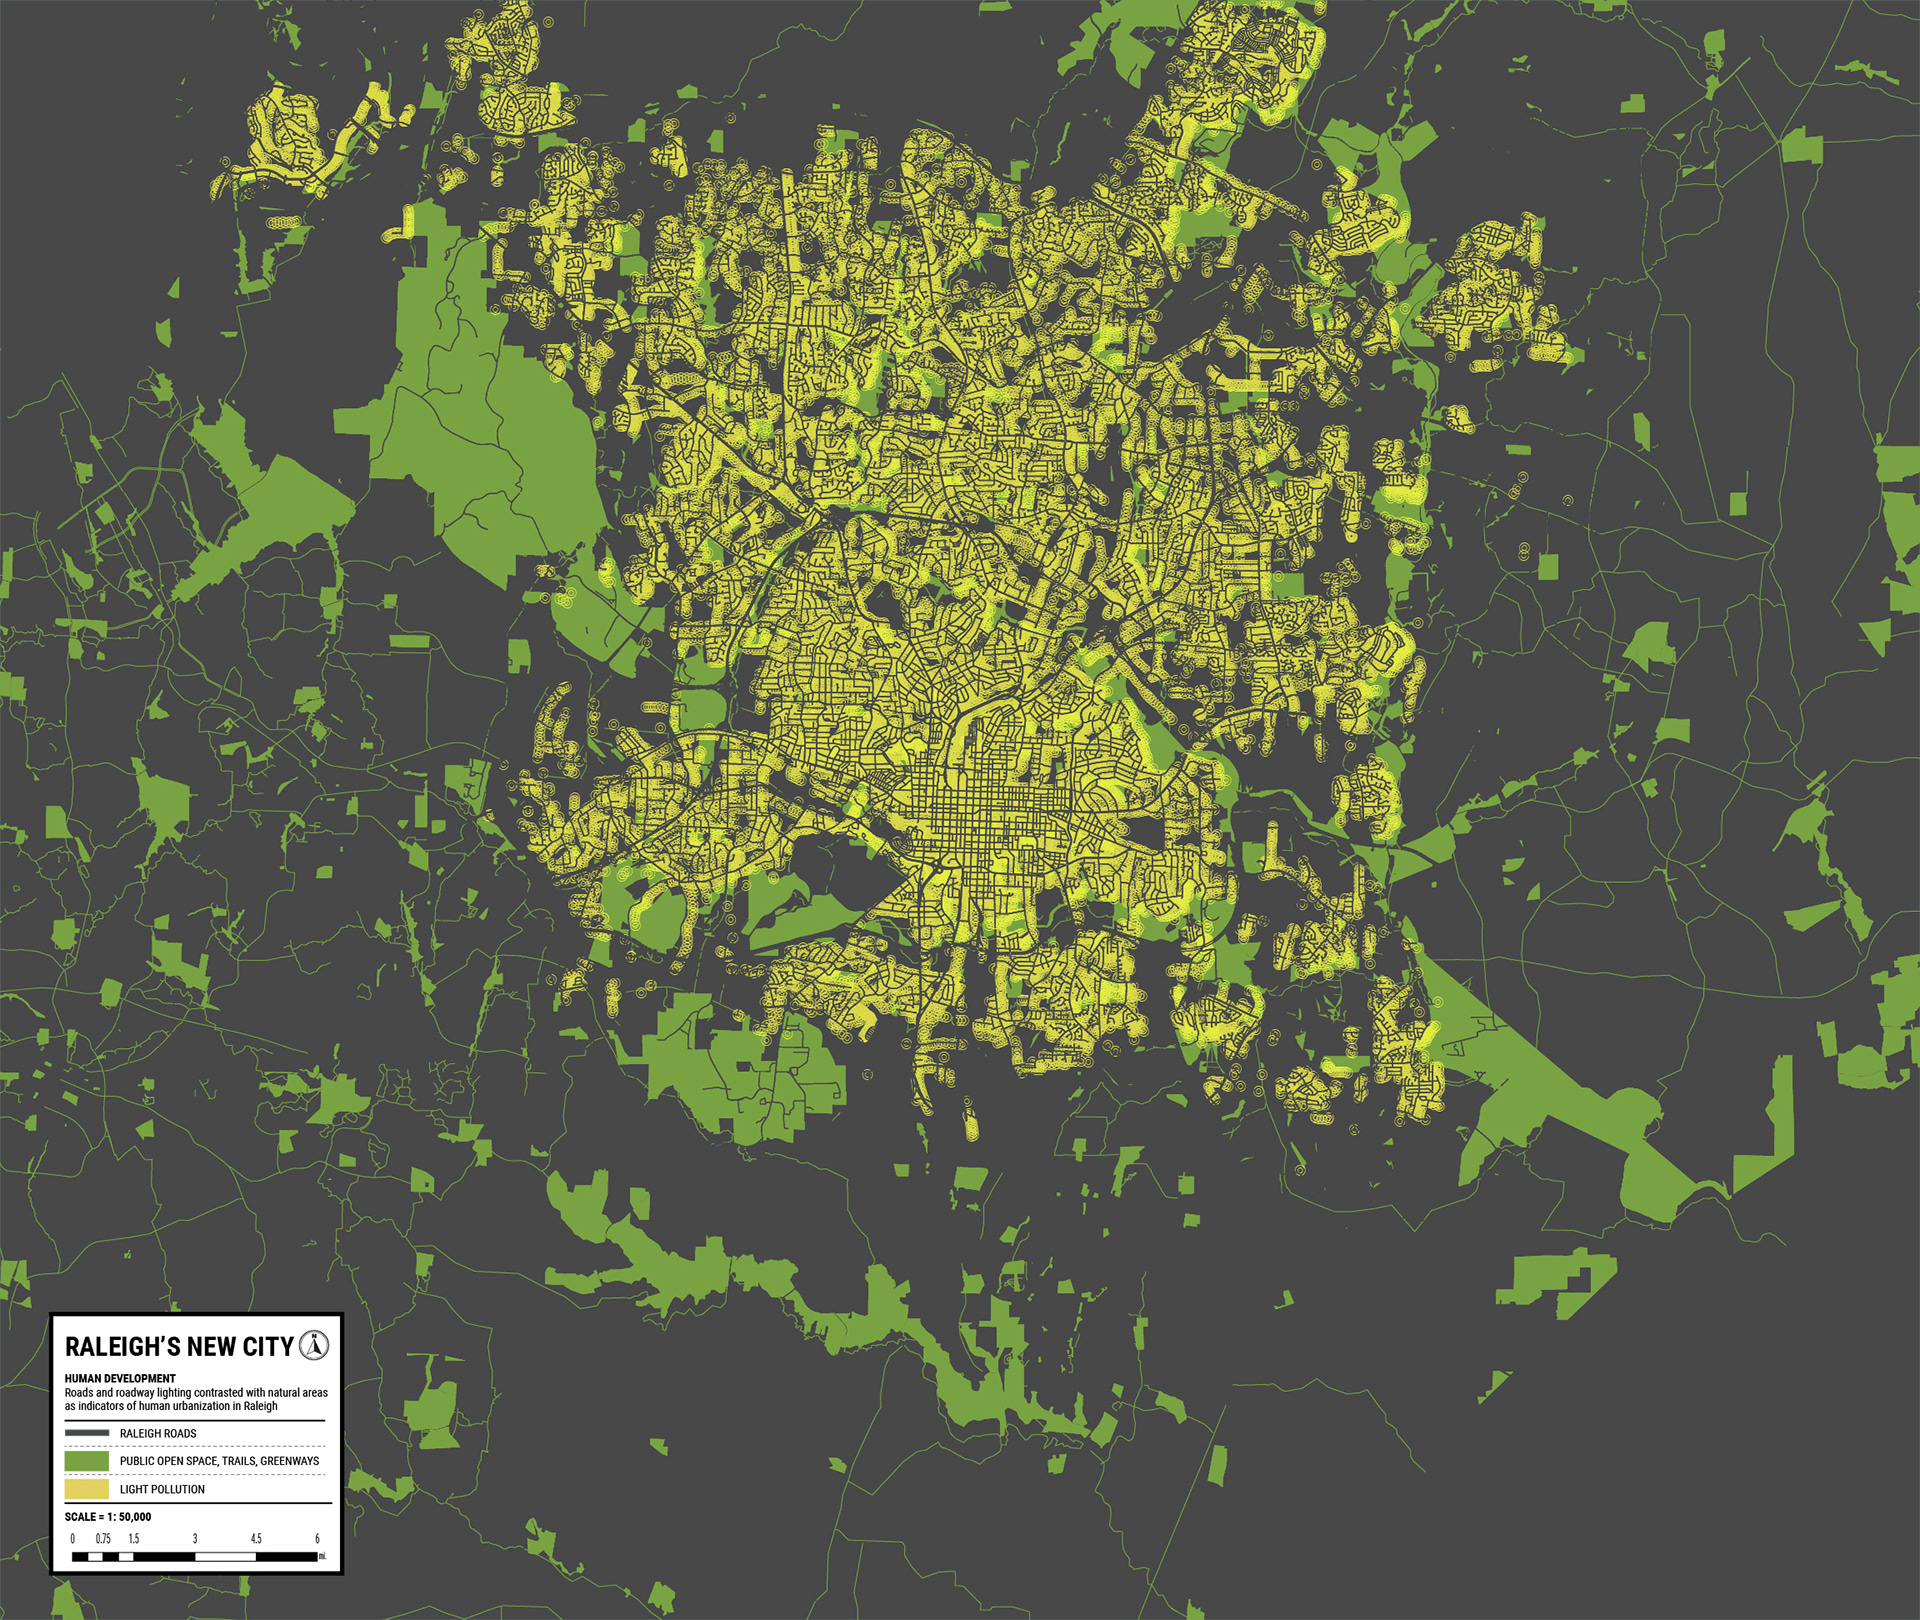
Contrasts streetlight pollution with greenways, trails, and parks in Raleigh. Light pollution is an indicator of human habitation. In what way does it interfere with natural areas?
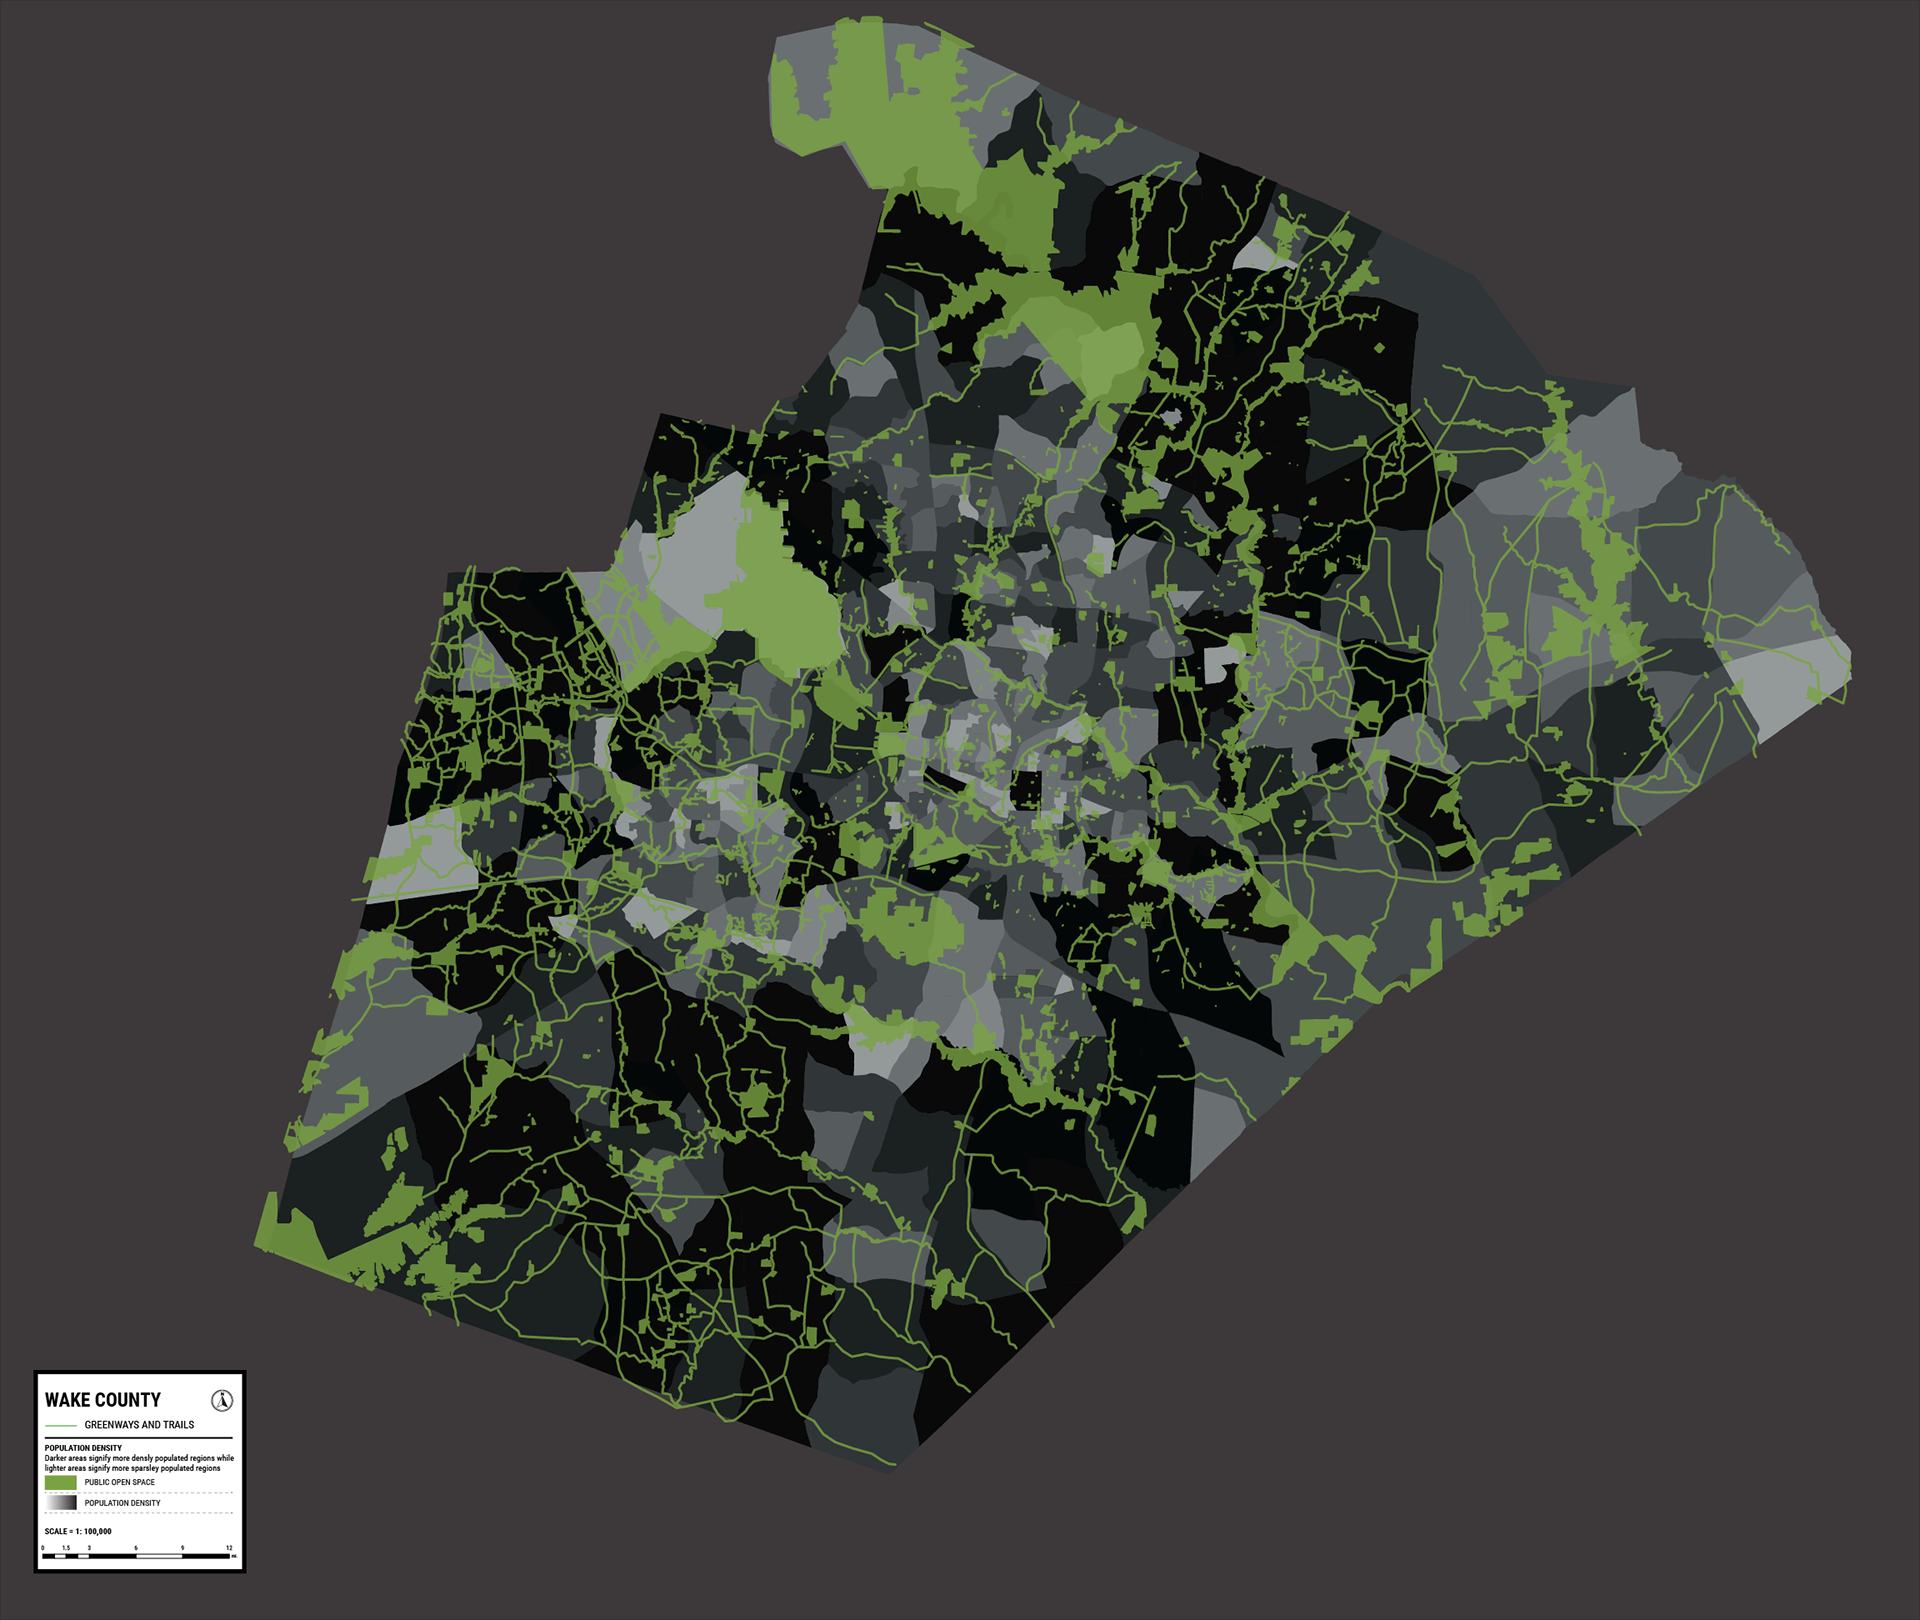
Displays how greenways, trails, and parks intersect with areas of differing population in Wake County. Does a dense population correlate with more or less greenery?

Shows how areas with preserved flora and fauna in North Carolina intersect with greenways and trails in Wake County. What effect does human presence in nature have on conservation areas?
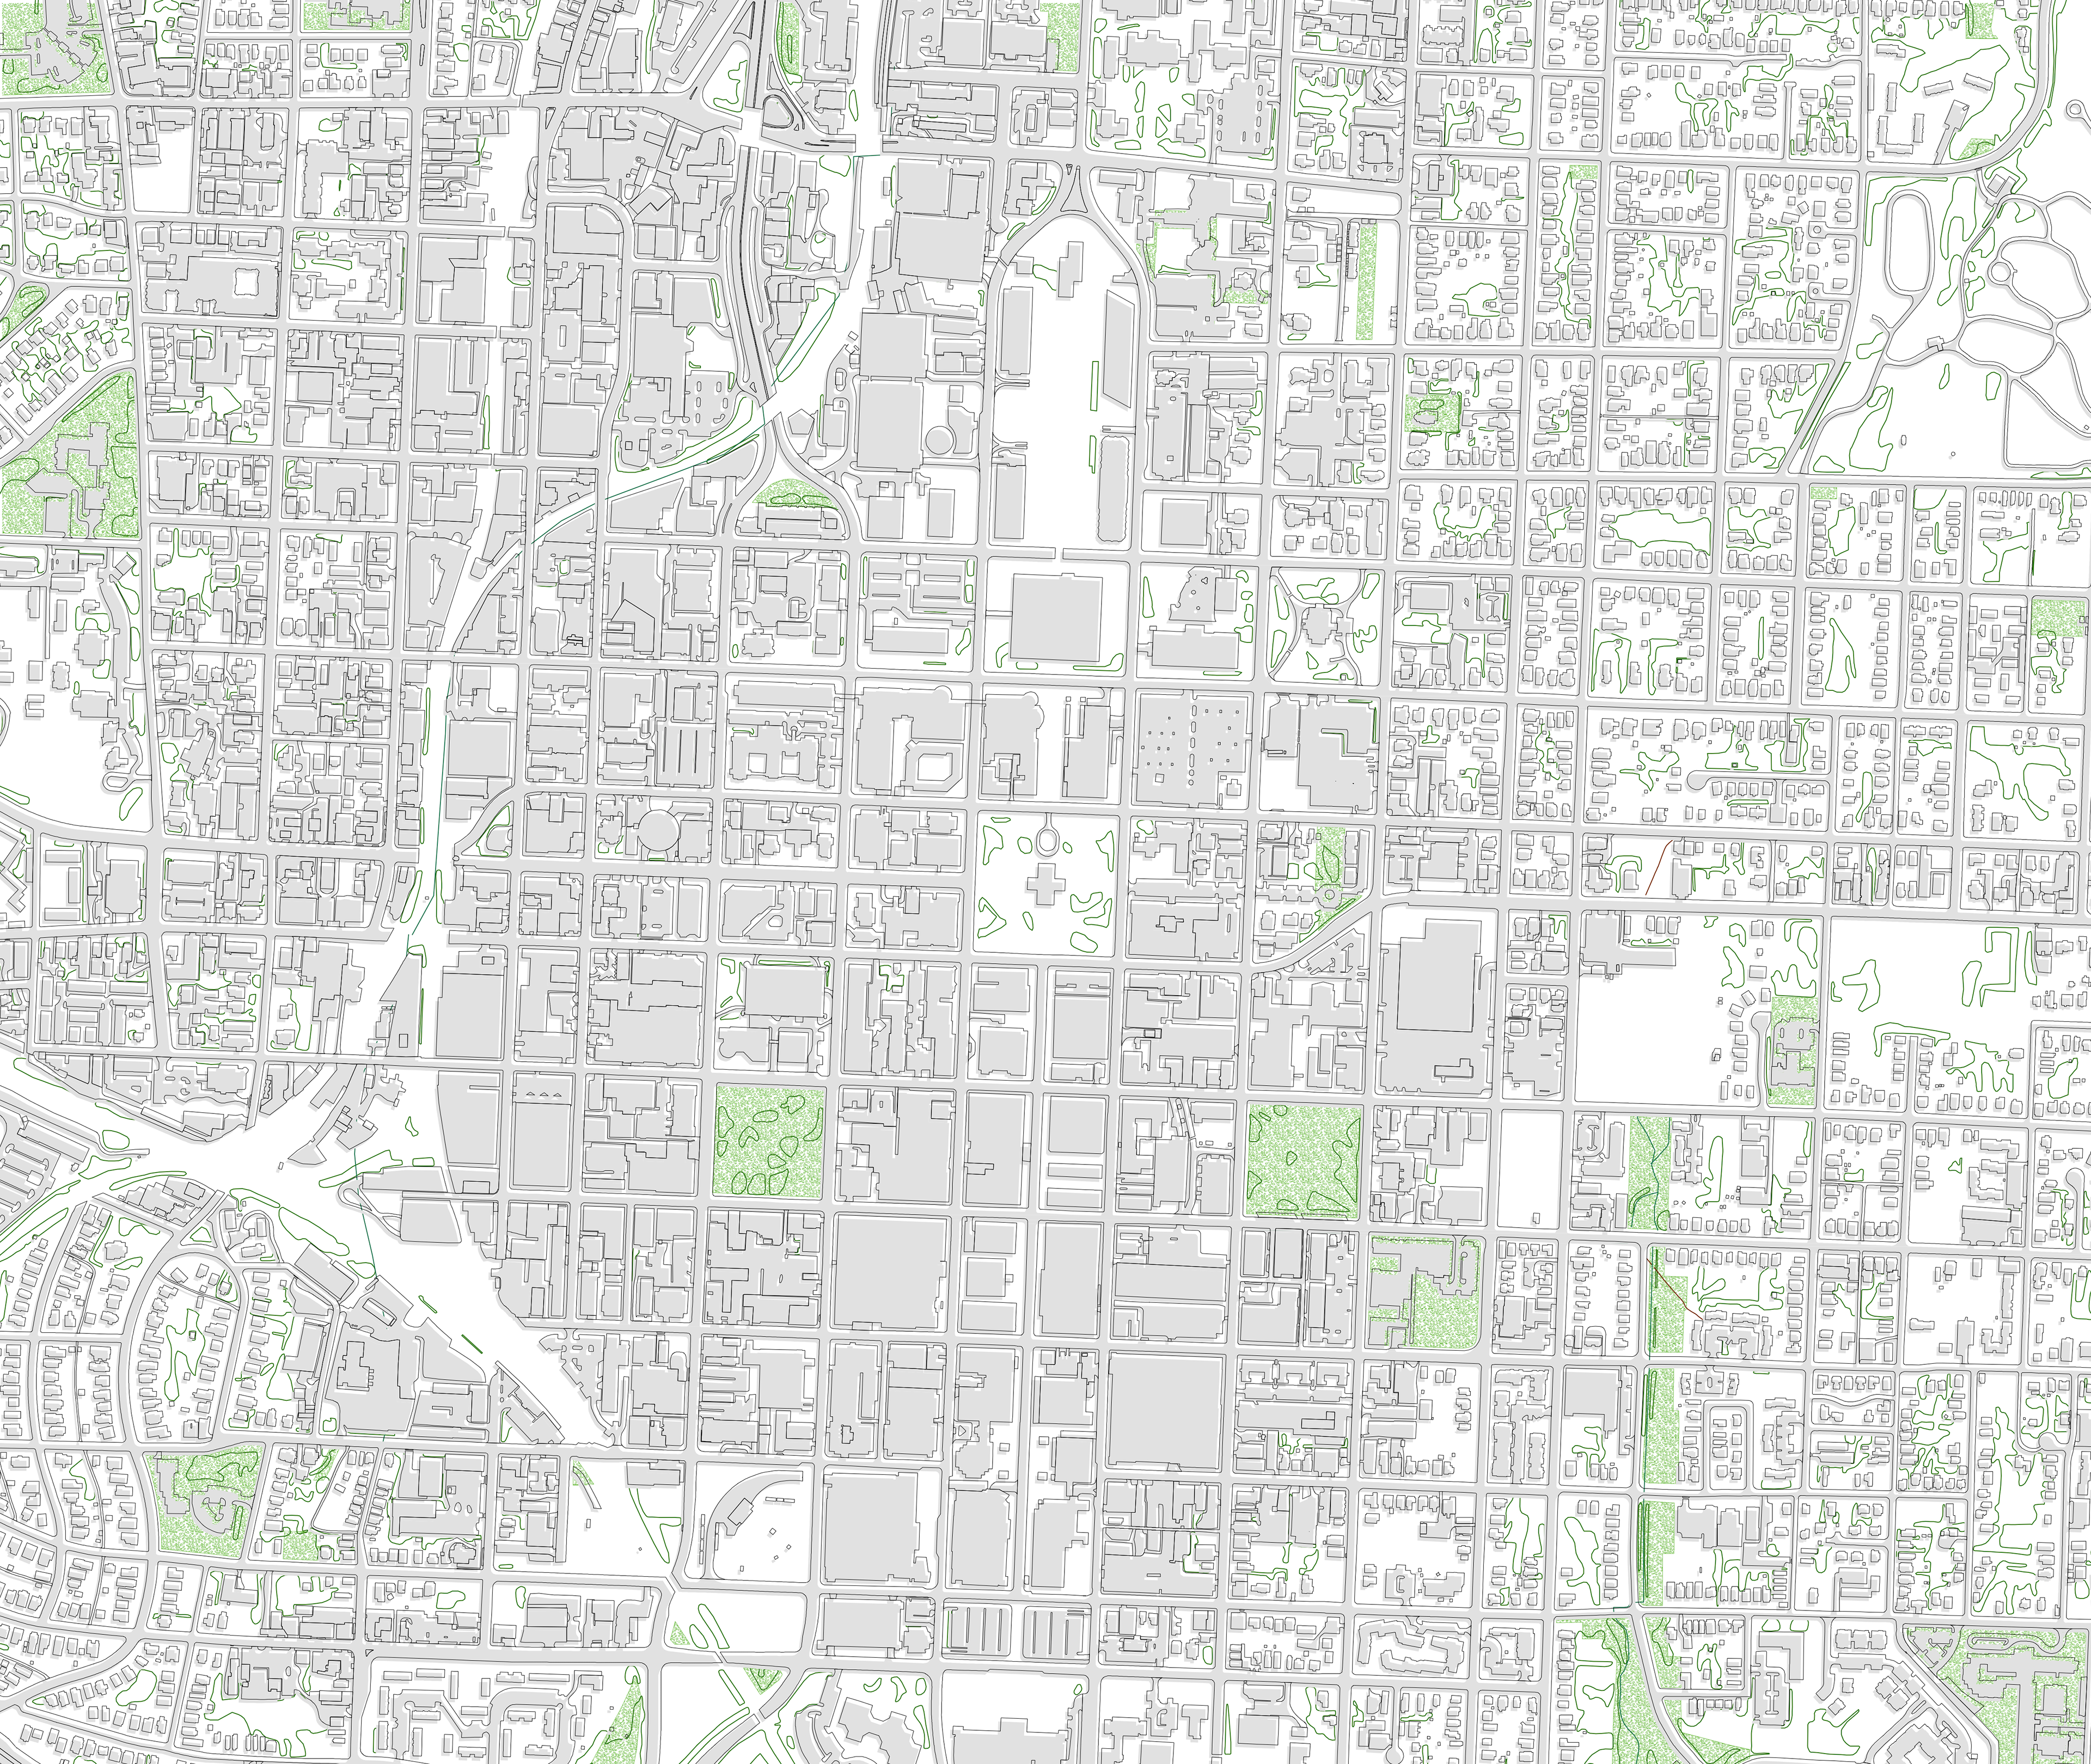
Current public open greenspace Downtown.
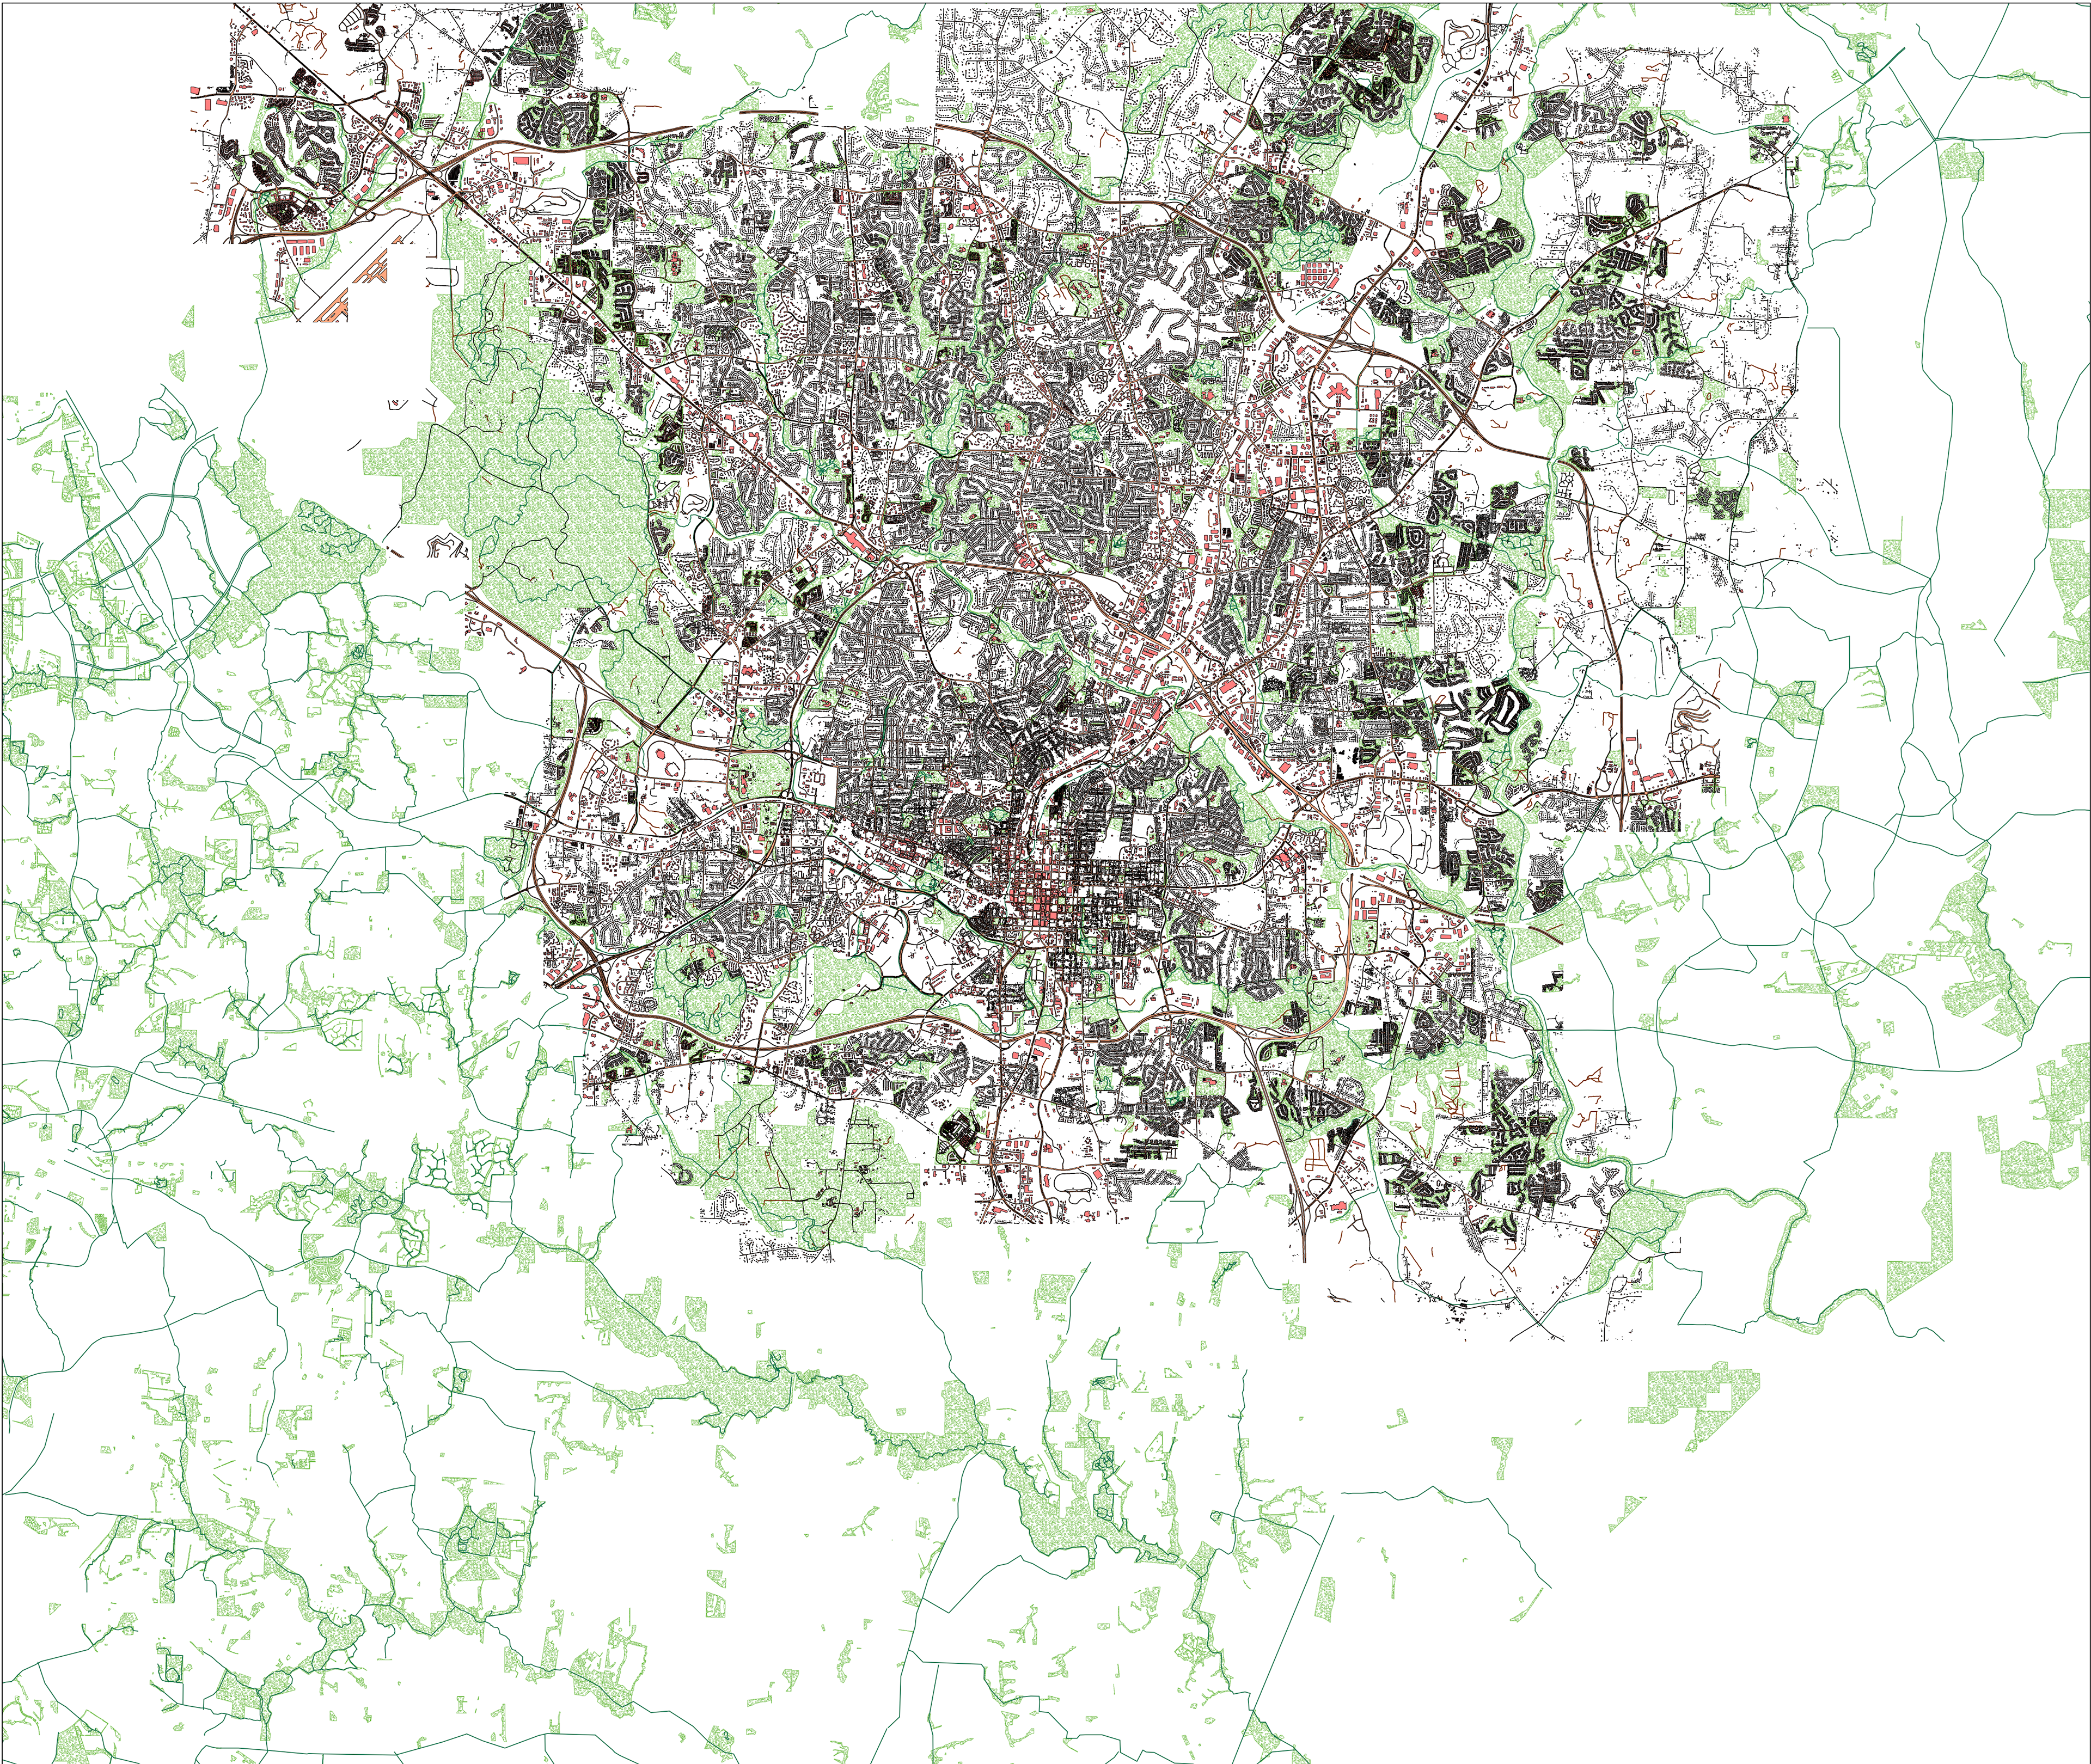
Parking and roads in New Raleigh.
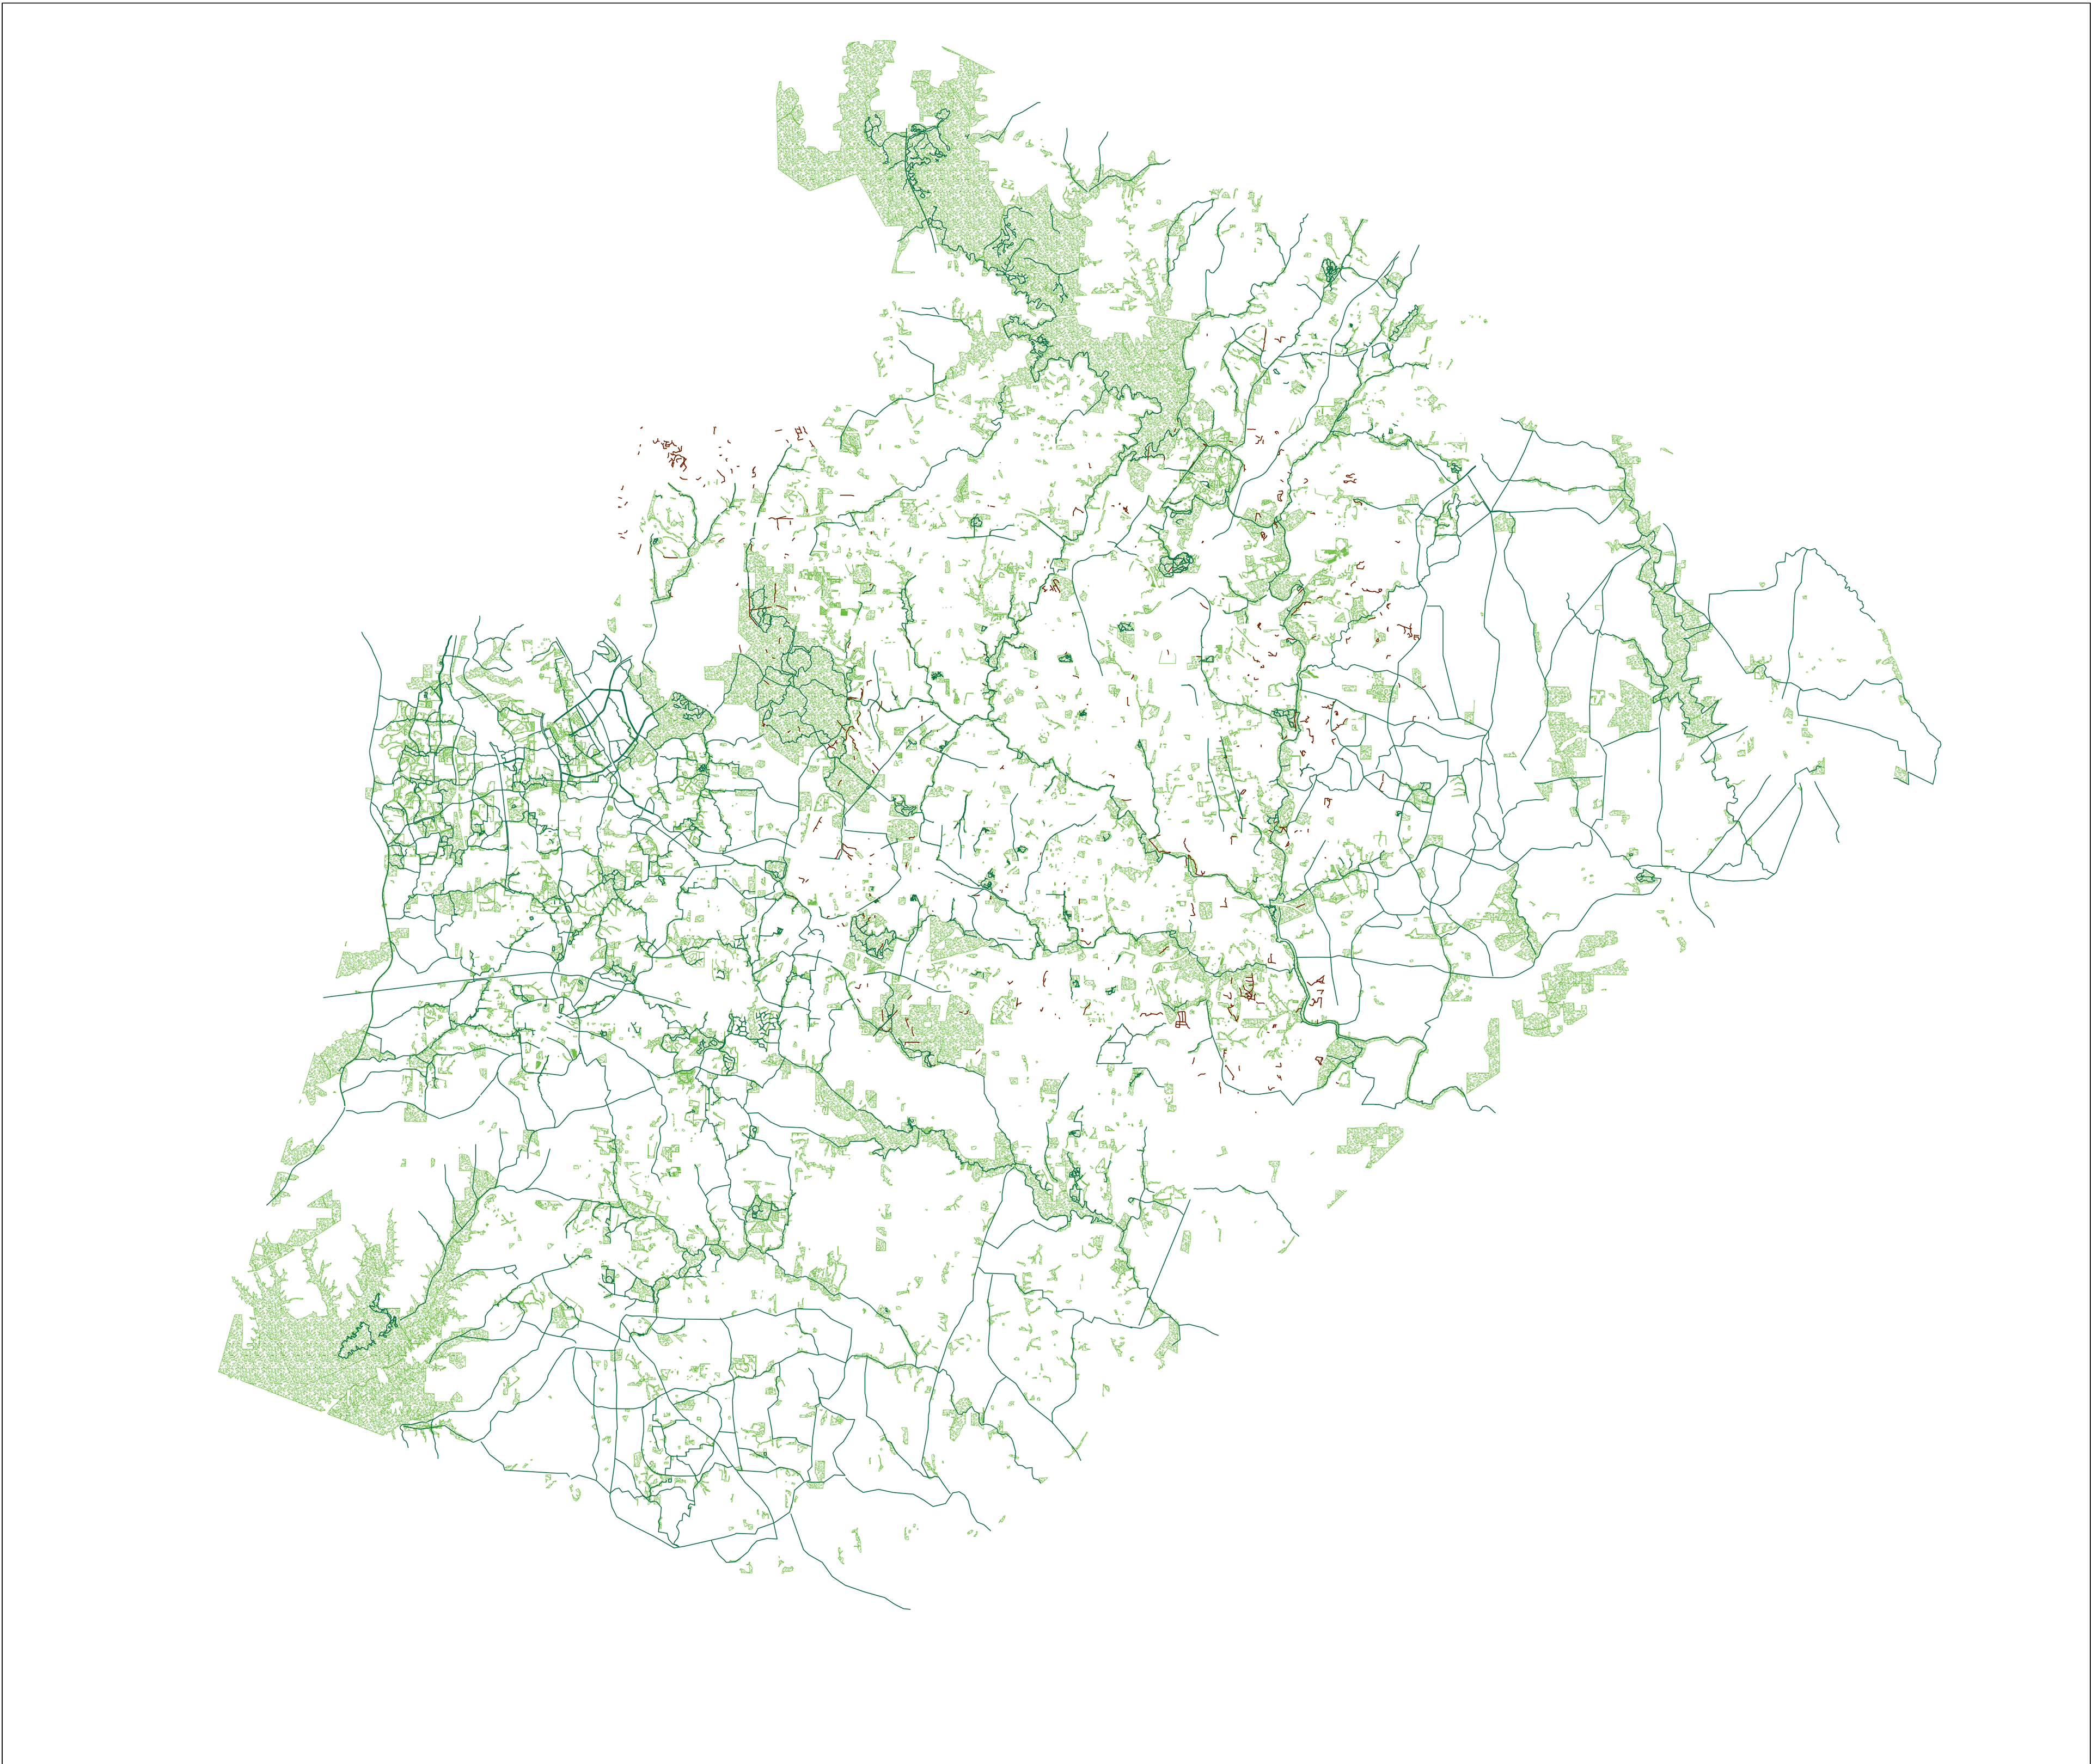
Parks, trails, and greenways in Wake County.